Calculation of titration curves
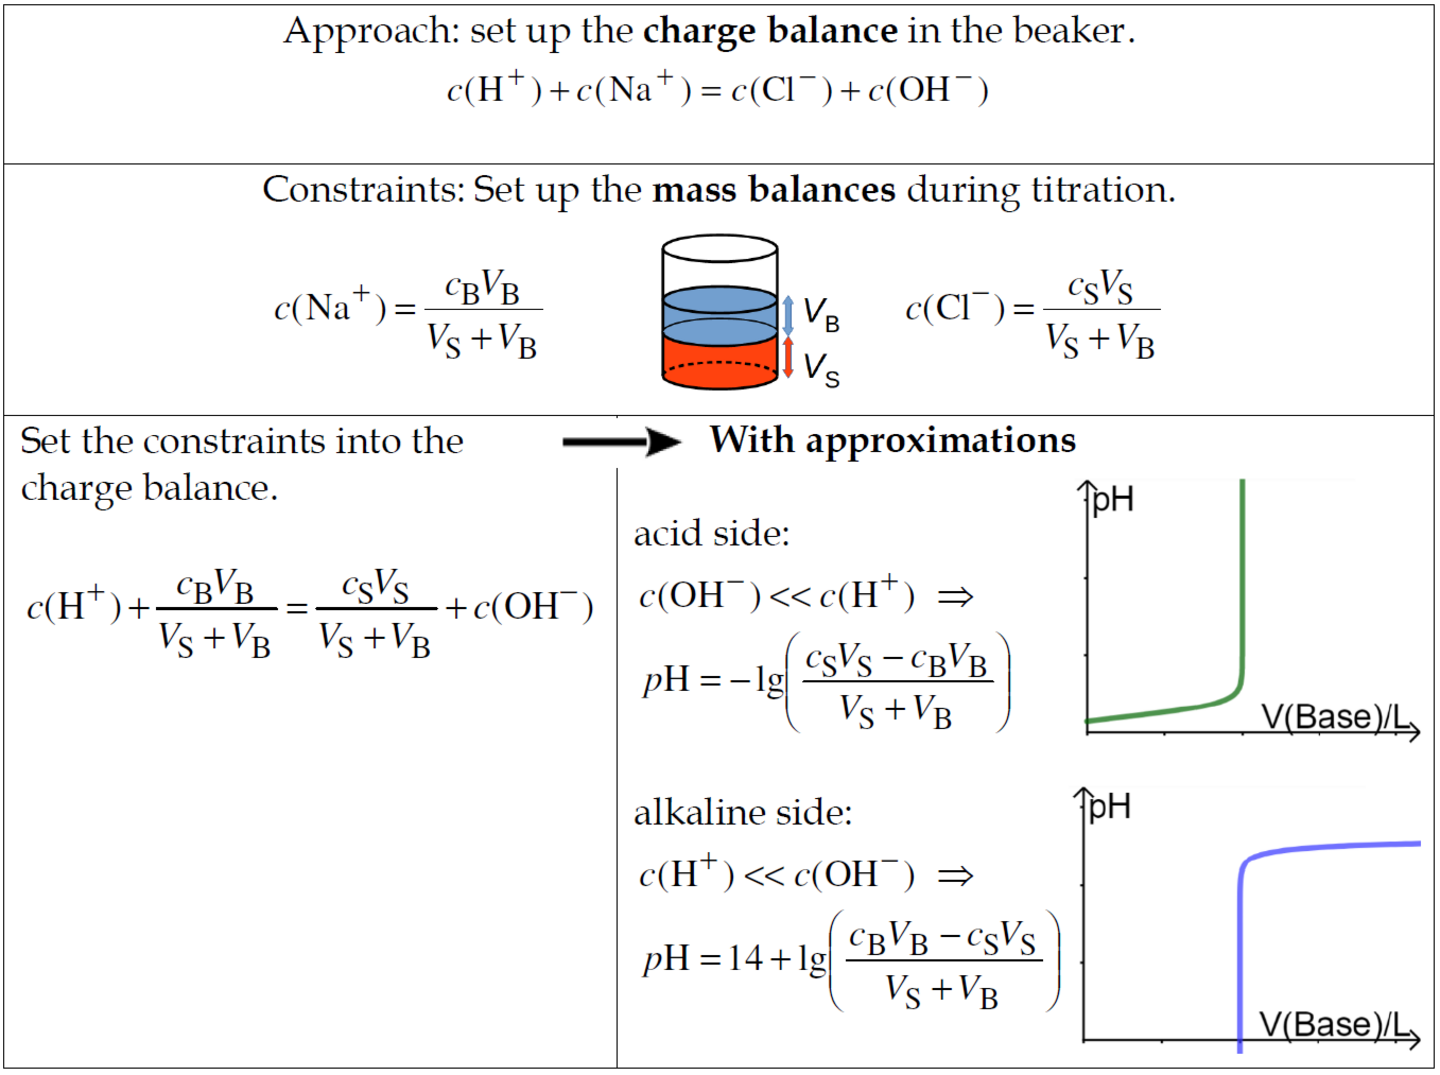
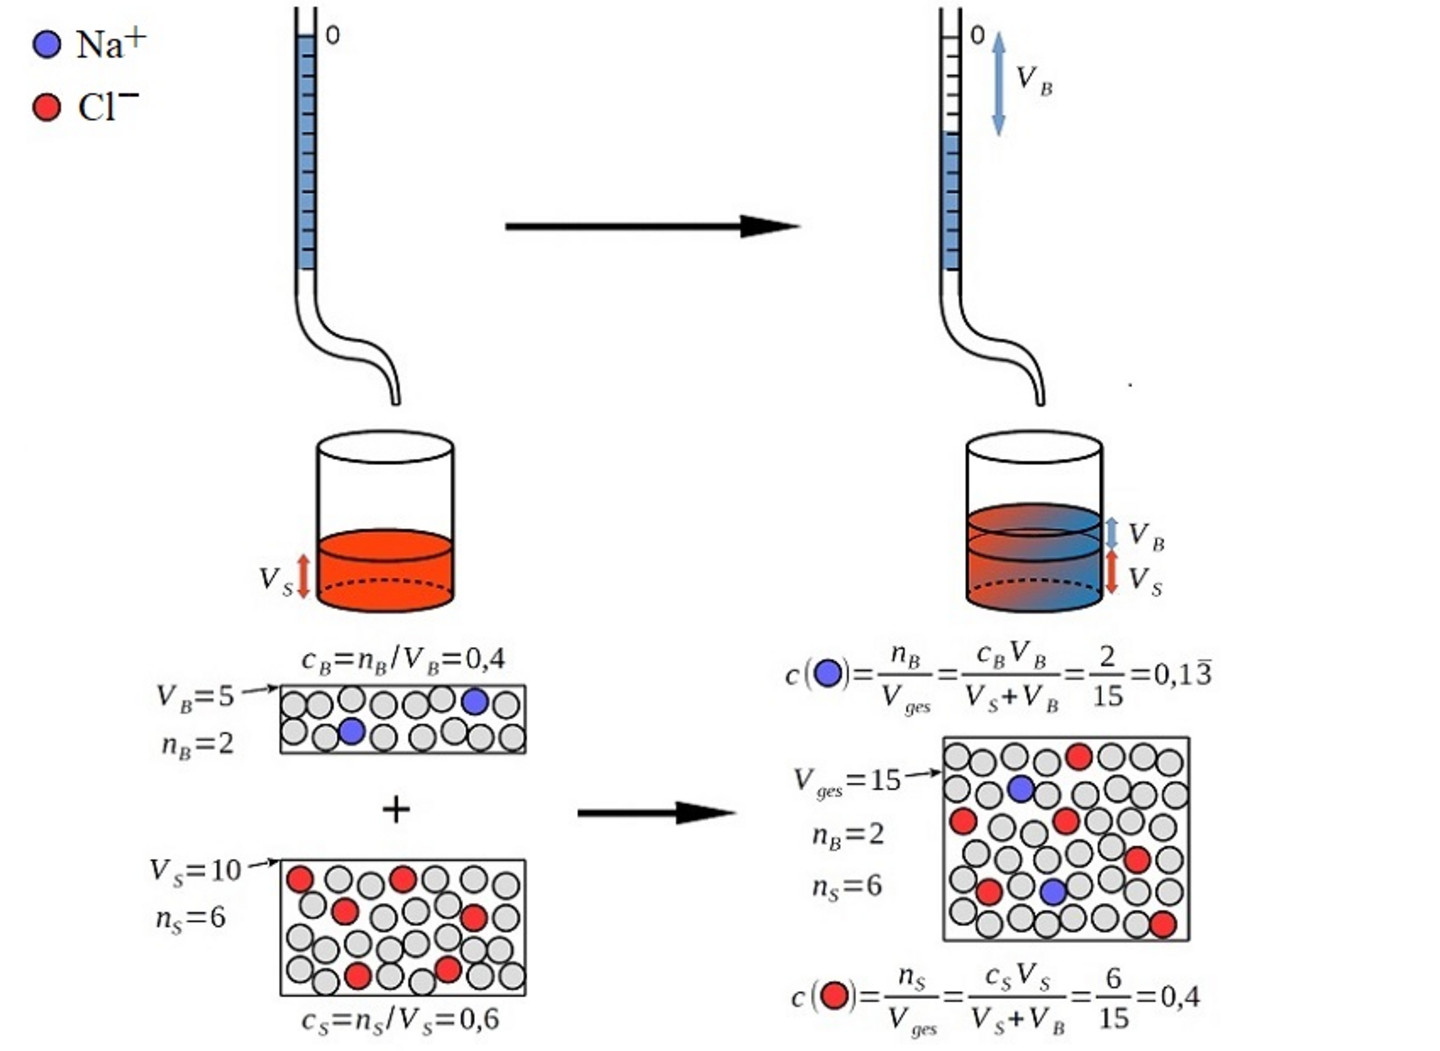
Based on the charge and particle balance, students can simulate the curve for the titration of a strong acid with a strong base. Approximations for the acidic and basic sides provide two simple equations.
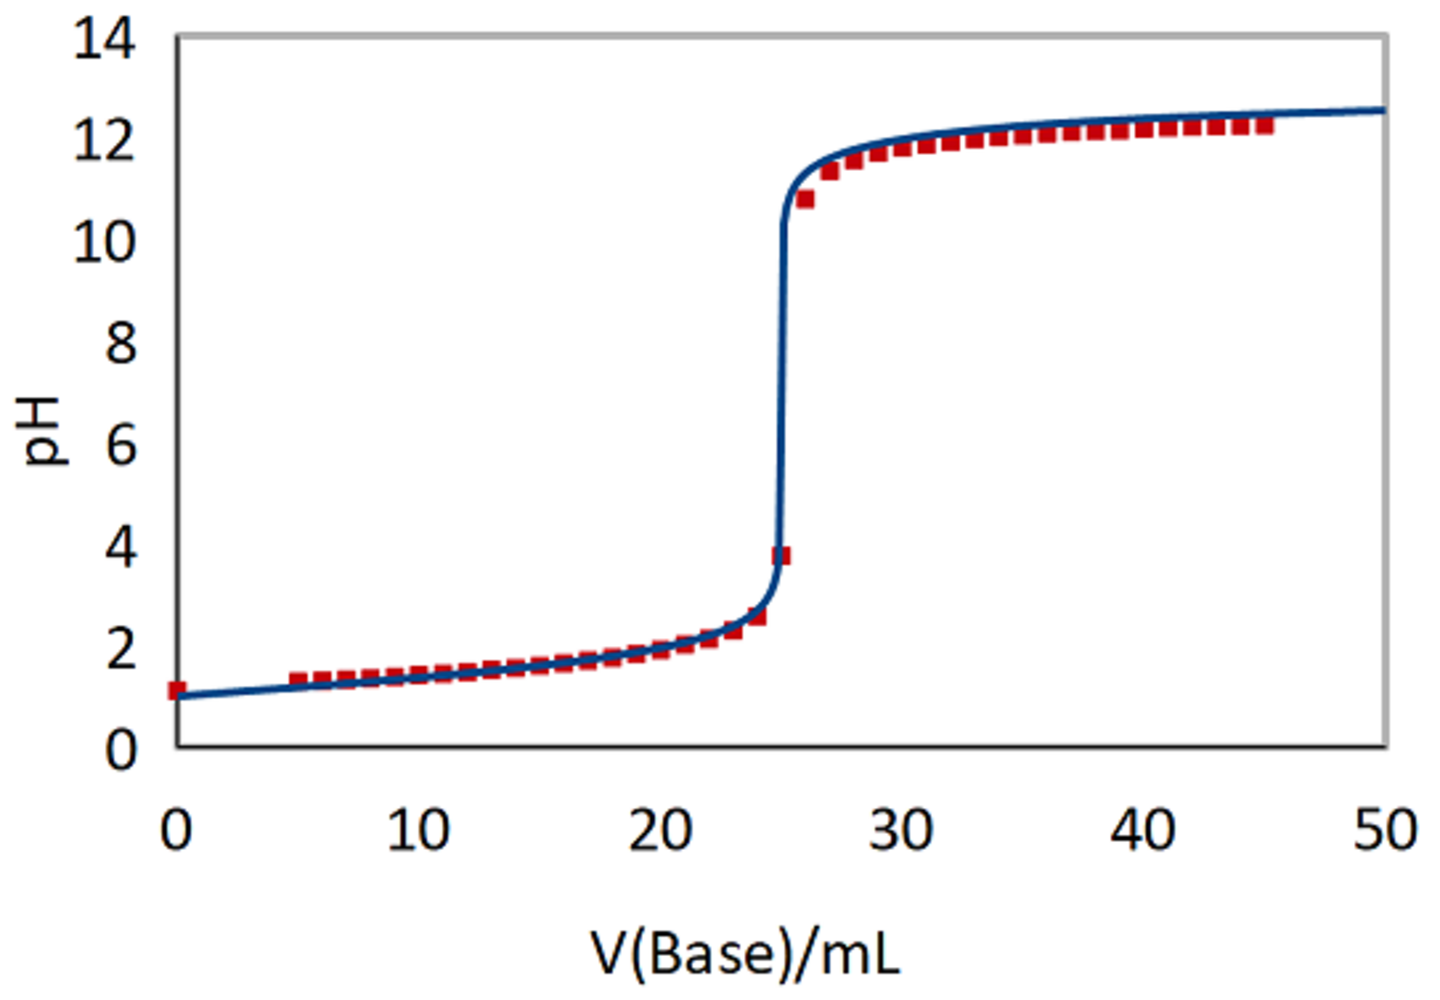
When put together in a diagram, the two graphs form the titration curve. The figure shows the comparison of a titration curve calculated in this way with experimental data from a titration of hydrochloric acid with sodium hydroxide solution (0.1 M each) using school resources.
https://doi.org/10.1002/ckon.201900015